Hello,
I was attempting to recreate the inverter efficiency curves in Python, but am having some trouble understanding the Inverter.cs file. As I understand it, the first step is to create a piecewise linear interpolation of the three efficiency vs. power curves, as in figure 1 below. Values that are found outside of the given points are extrapolated from the closest piecewise linear interpolation.
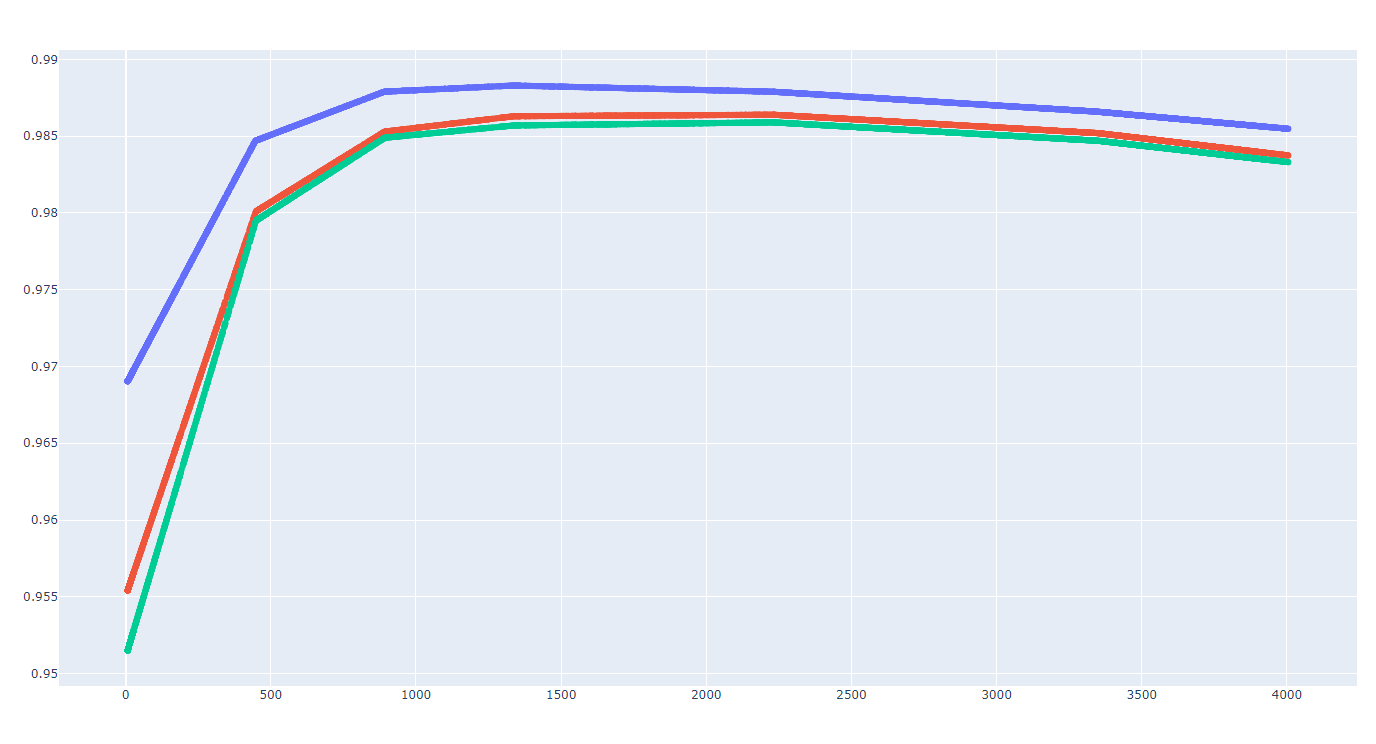
Figure 1. Piecewise linear interpolation of the three efficiency vs. power curves.
Then the next step is to take the array input power and find the resulting efficiency points on each of the curves. This will give us 3, 2-dimensional points where the x value is the voltage curve that the points was taken from and the y value is the efficiency at the input power.
Then the goal is to take a quadratic interpolation of the three curves which should give us the resulting efficiency at the array input voltage.
Now, if I follow the steps above I end up with predicted efficiency values which increase at lower voltages which to me makes sense given that as voltage decreases efficiency increases in the 3 curves given by the inverter file.
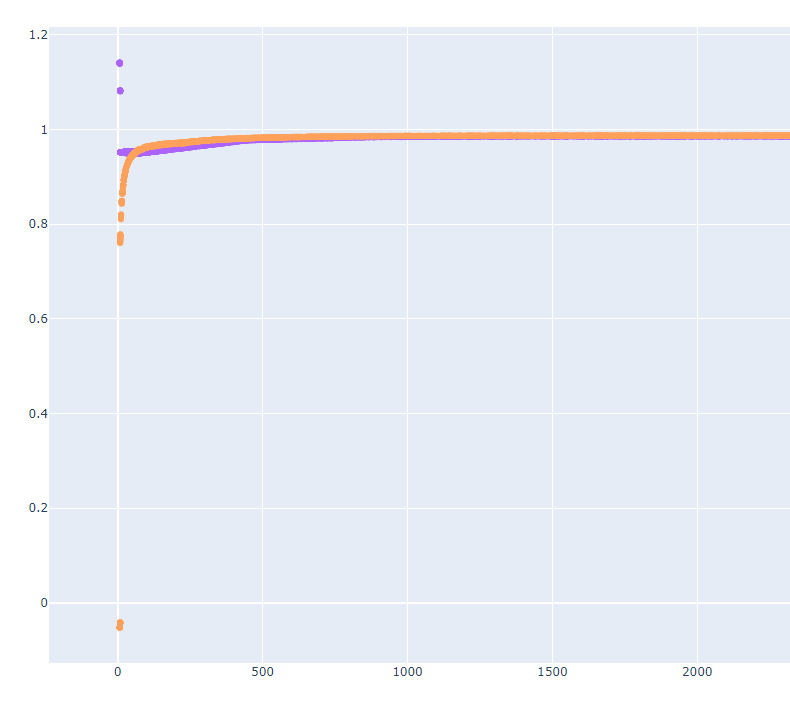
Figure 2. Increasing efficiency at lower voltages (purple curve). PVSyst efficiency (yellow curve)
I have tried adding another point to the data at Voltage = 0, efficiency = 0, but that didn't seem to help the fit either. I have also followed the Cassys inverter.cs file which divides efficiency by input power before the quadratic interpolation step. This gives me an upside down curve.
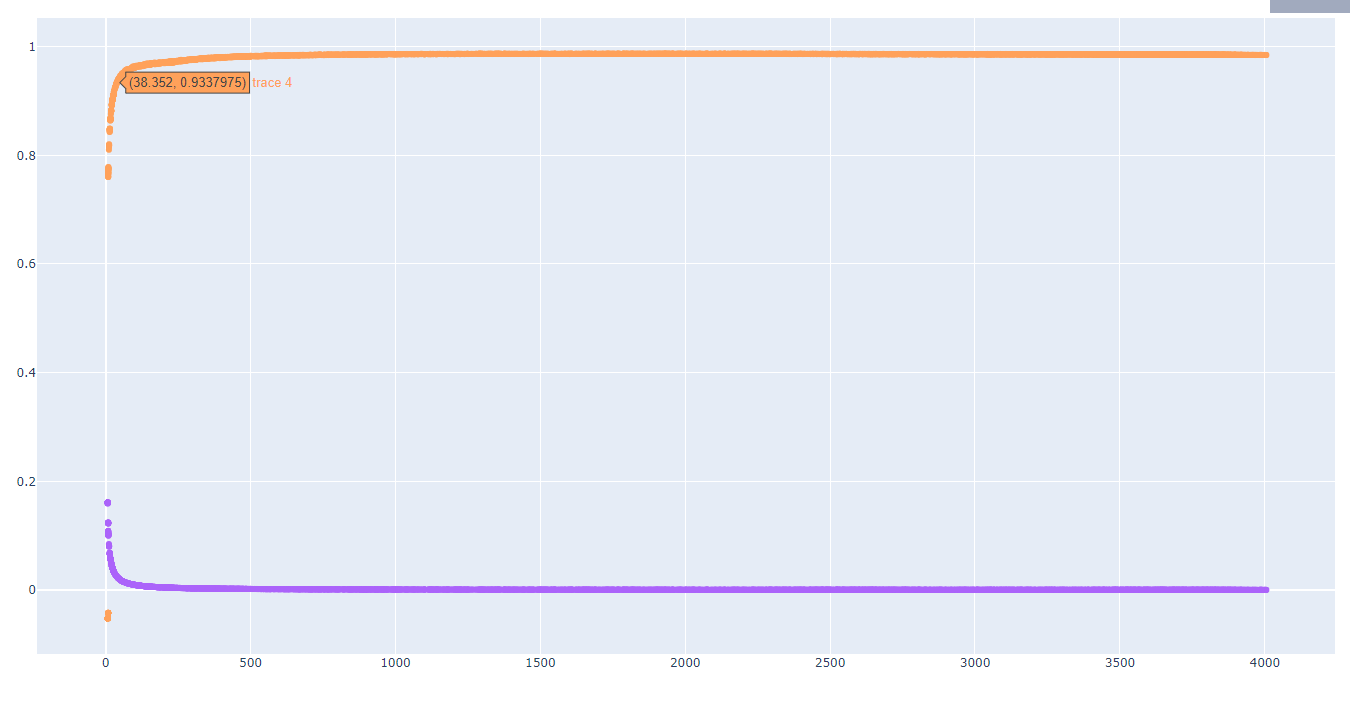
Figure 3. Using efficiency/power as the y values for the quadratic interpolation
Thank you so much for your help!
Hello,
I was attempting to recreate the inverter efficiency curves in Python, but am having some trouble understanding the Inverter.cs file. As I understand it, the first step is to create a piecewise linear interpolation of the three efficiency vs. power curves, as in figure 1 below. Values that are found outside of the given points are extrapolated from the closest piecewise linear interpolation.
Figure 1. Piecewise linear interpolation of the three efficiency vs. power curves.
Then the next step is to take the array input power and find the resulting efficiency points on each of the curves. This will give us 3, 2-dimensional points where the x value is the voltage curve that the points was taken from and the y value is the efficiency at the input power.
Then the goal is to take a quadratic interpolation of the three curves which should give us the resulting efficiency at the array input voltage.
Now, if I follow the steps above I end up with predicted efficiency values which increase at lower voltages which to me makes sense given that as voltage decreases efficiency increases in the 3 curves given by the inverter file.
Figure 2. Increasing efficiency at lower voltages (purple curve). PVSyst efficiency (yellow curve)
I have tried adding another point to the data at Voltage = 0, efficiency = 0, but that didn't seem to help the fit either. I have also followed the Cassys inverter.cs file which divides efficiency by input power before the quadratic interpolation step. This gives me an upside down curve.
Figure 3. Using efficiency/power as the y values for the quadratic interpolation
Thank you so much for your help!