


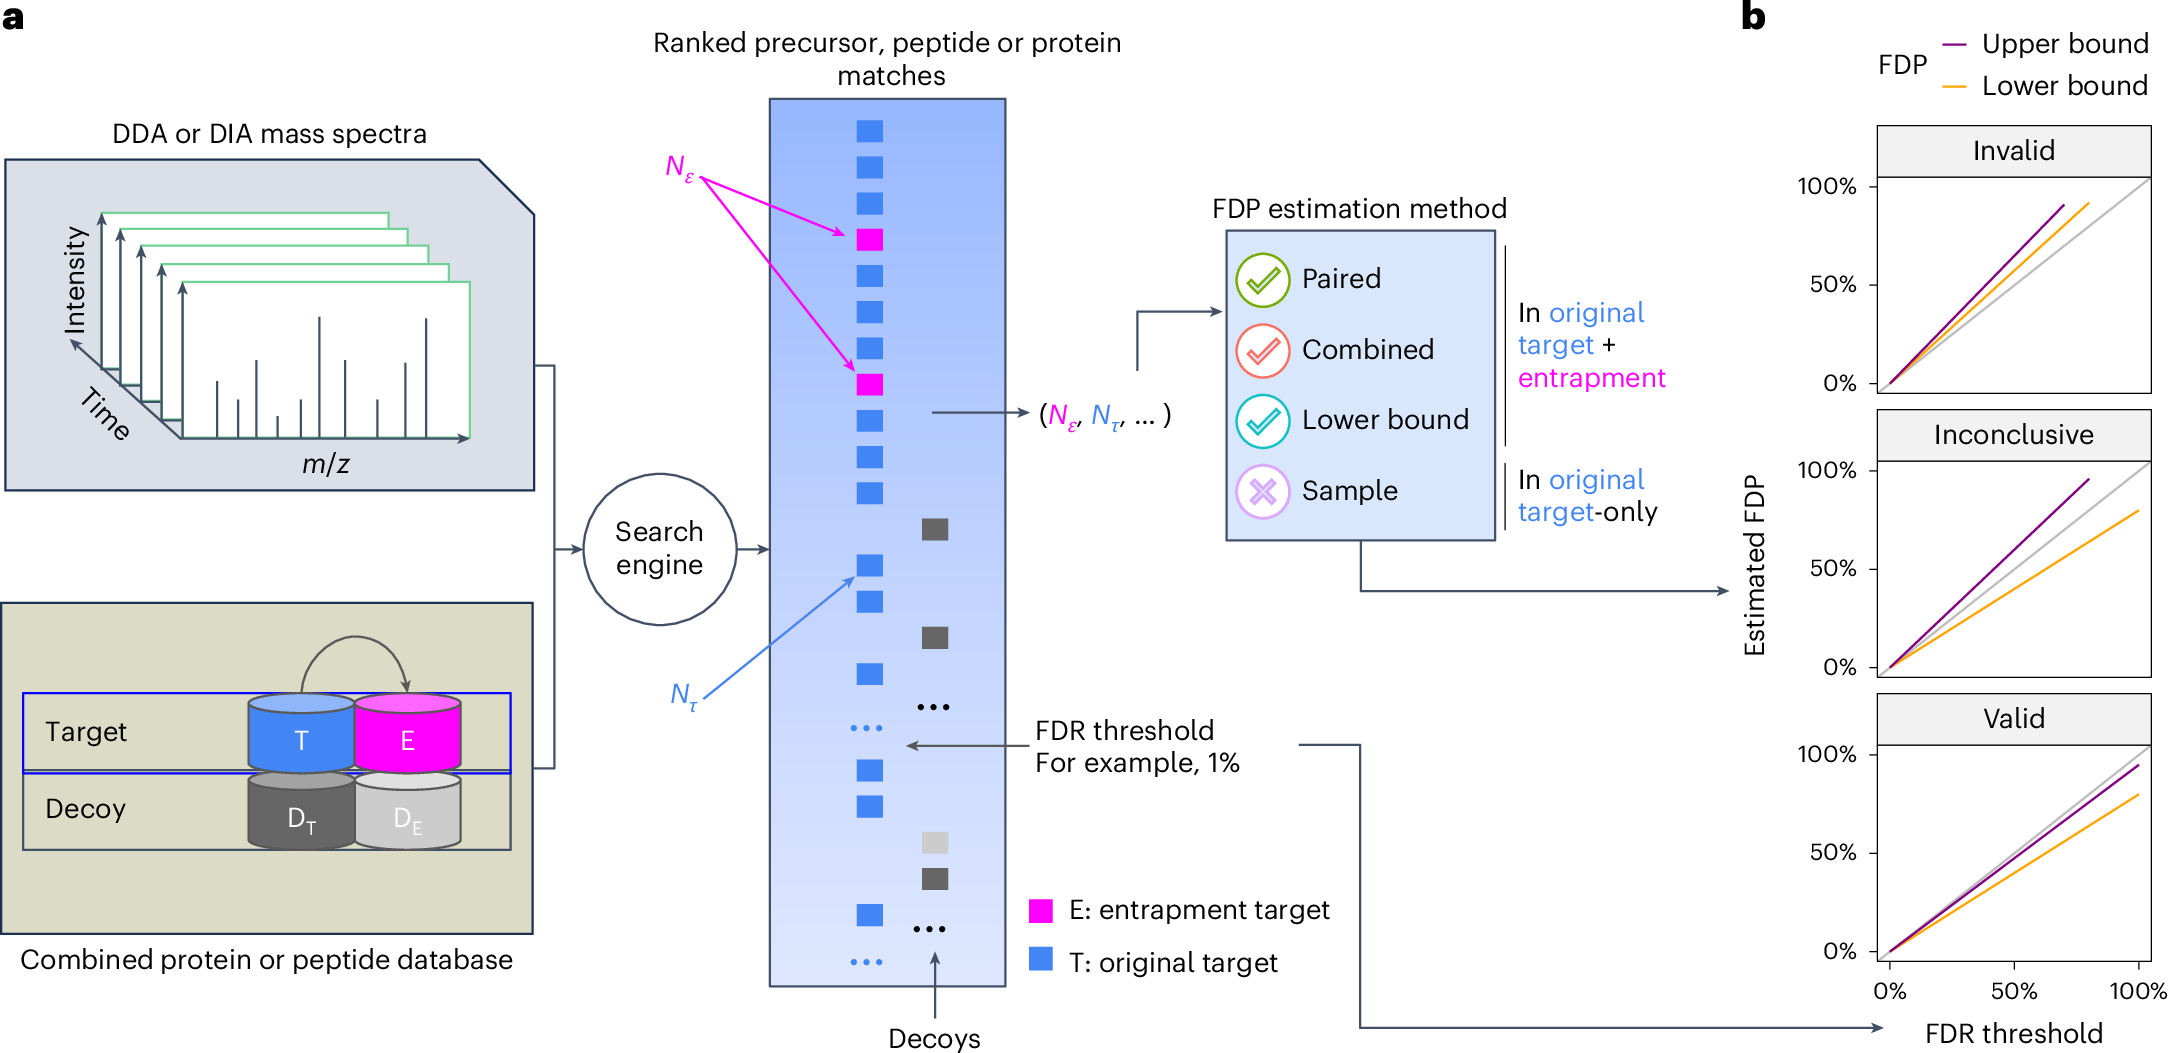
FDRBench is a tool for false discovery rate (FDR) control evaluation in proteomics. It provides two main functions: (1) build entrapment databases using randomly shuffled target sequences or using sequences from foreign species, and (2) estimate the false discovery proportion (FDP) using the lower bound, combined, and paired methods. FDRBench has been tested on identification results from a wide range of search engines, including DIA-NN, MSFragger, Spectronaut, MaxQuant, Tide, and others. More details about how FDRBench works are provided in the following manuscript:
Wen, B., Freestone, J., Riffle, M. et al. Assessment of false discovery rate control in tandem mass spectrometry analysis using entrapment. Nat Methods 22, 1454–1463 (2025).
FDRBench provides a standalone graphical user interface (GUI) for Windows, Linux and macOS. You can install it from the .msi (Windows) package available on the GitHub Releases page. For Linux and macOS, use the ZIP package instead. After installation on Windows, launch FDRBench from the Start menu and use the GUI to configure inputs, parameters, and output locations for entrapment database generation and FDP estimation without using the command line. No Java is required if FDRBench is installed using the .msi installer. For Linux and macOS, FDRBench can be run using the command line (see below) to launch the GUI.
FDRBench is written in Java and can run on Windows, macOS, and Linux. To run FDRBench from the command line, Java must be installed. If Java is not installed, please install it by following the instructions at https://openjdk.org/install/ or https://www.oracle.com/java/technologies/downloads/. After Java is installed, FDRBench can be downloaded from https://github.com/Noble-Lab/FDRBench/releases.
After FDRBench is installed using the .msi installer, launch the GUI by clicking the FDRBench icon in the Start menu or the desktop shortcut.
On Linux or macOS, launch the GUI from the command line:
java -jar fdrbench-1.0.0.jarThe FDRBench GUI:

In the FDRBench GUI, hover the mouse pointer over a field label, input box, or button to display a tooltip with additional help about that option.
The GUI supports the two main FDRBench workflows:
- Entrapment database generation;
- FDP estimation / FDR control evaluation.
Use this workflow to build an entrapment database from a target protein FASTA. Two sequence-generation modes are supported, selected from the Sequence Generation dropdown:
- Random Shuffling — entrapment sequences are derived from the target database by random shuffling. Both peptide-level and protein-level entrapment databases can be generated.
- Foreign Species — entrapment sequences are taken from one or more foreign-species FASTA files supplied by the user. Both peptide-level and protein-level entrapment databases can be generated.
The main inputs:
- Protein Database: target protein database in FASTA format. The Download button opens a dialog for downloading a UniProt reference proteome directly inside the GUI.
- Foreign Species (Foreign Species mode only): one or more FASTA files used as entrapment sources. Multiple files can be selected.
- Output Folder: directory where the entrapment FASTA and peptide pair file (for peptide level entrapment database generation only) are written. The output file formats are described in the Build entrapment databases section below.
Key parameters in the workflow include the Level (protein or peptide), Enzyme, Missed Cleavages, Peptide Length, Fold (number of entrapment copies per target), Fix N/C Terminal, Convert I to L, DIA-NN Format, UniProt Format, Add Decoys, and Check Duplicates. The available options change automatically based on the Level and Sequence Generation selections — only the parameters that are relevant for the chosen combination are shown.
After all the inputs and parameters are set, click the Run FDRBench button to start the run. The Preview Command button shows the exact command line that will be executed, which is useful for reproducibility and for switching to the command line later. During the run, console output will be shown in the Console tab. After the run is finished, the output folder will contain the generated entrapment FASTA file, the peptide pair *.txt file (peptide-level runs), and fdrbench_log.txt, which mirrors the console output for the run.
Use this workflow to estimate the FDP of a peptide or protein detection result using the lower bound, combined, and paired methods.

The main inputs:
- Input File: PSM / peptide / precursor / protein level identification file (TSV format). Decoy hits should be removed from the input file before FDP calculation. The format is described in the FDP estimation section below.
- Peptide Pair File (optional): the peptide pair
*.txtfile generated in Workflow 1. Required for the paired method at the peptide or precursor level. - Output Folder: directory where the FDP estimation result and FDP-vs-FDR plot are written. The output file format is described in the FDP estimation section below..
Key parameters in the workflow include the Level (precursor, peptide, protein, or PSM), the Sequence Generation mode used to build the entrapment database (Random Shuffling or Foreign Species), the Score Column and ranking Direction, the Fold (Random Shuffling) or R Ratio (Foreign Species), the Pick Method for protein-group handling, and the Entrapment Label and Label Position that identify entrapment sequences in the input file.
After all the inputs and parameters are set, click the Run FDRBench button to start the run. During the run, console output will be shown in the Console tab. After the run is finished, the output folder will contain a CSV file with the estimated FDP values from each method (lower bound, combined, paired when using random shuffling for entrapment generation), and fdrbench_log.txt. The Plot tab in the GUI displays the FDP-vs-FDR plot and supports interactive customization of the plot (FDR range, etc.) and exporting in PNG or PDF format.

FDRBench command line options
$ java -jar fdrbench-1.0.0.jar -h
usage: Options
 -db <arg>                 Protein database file
 -crux <arg>               The peptide list generated by Crux
 -target_pep <arg>         The target peptide list to consider
 -decoy                    Add decoy or not
 -clip_n_m                 When digesting a protein starting with amino acid M, two copies of the
                           leading peptides (with and without the N-terminal M) are considered or
                           not. Default is false.
 -fix_nc <arg>             Fix N/C terminal amino acid. n/N: only N terminal, c/C: only C terminal
                           and nc/NC/cn/CN: both (default)
 -o <arg>                  Output file
 -I2L                      Convert I to L
 -diann                    For DIA-NN
 -uniprot                  For Uniprot
 -prosit                   Generate Prosit input file
 -charge <arg>             For prosit input: charge range, 2,3,4
 -nce <arg>                For prosit input: NCE
 -enzyme <arg>             Enzyme used for protein digestion. 0:Non-specific, 1:Trypsin, 2:Trypsin (no
                           P rule) (default), 3:Arg-C, 4:Arg-C (no P rule), 5:Arg-N, 6:Glu-C,
                           7:Lys-C, 8: NoCut
 -miss_c <arg>             The max missed cleavages, default is 1
 -minLength <arg>          The minimum length of peptide to consider, default is 7
 -maxLength <arg>          The maximum length of peptide to consider, default is 35
 -export_db                Export protein database or not
 -seed <arg>               Random seed for generating decoy peptides
 -fix_seed                 Use a fixed random seed for all decoy peptides generation
 -fold <arg>               The number of folds for generating entrapment proteins/peptides
 -r <arg>                  For FDP calculation: #entrapment/#target
 -use_v1 <arg>             Use the first version of FDP calculation for 1-fold
 -pick <arg>               If a group has multiple proteins, how to peak one protein: first
                           (default),last,random
 -a                        Generate entrapment protein(s) for each target protein independently
 -check                    Checking for duplicates and random shuffling
 -method <arg>             The method to generate a random peptide: 0:shuffle (default), 1:swap
 -ms <arg>                 Multiple species entrapment: Fasta files of foreign species
 -ns                       no shared peptides between entrapment and target protein
 -swap                     Reverse the order of generated random peptide sequences
 -i <arg>                  PSM/peptide/precursor/protein file
 -score <arg>              The score name for ranking precursor/peptide/protein for FDP calculation.
                           The format could be "score", "score:0" or "score:1". The second part is 0
                           or 1, 0: lower is better, 1: higher is better
 -level <arg>              PSM, peptide, precursor or protein
 -pep <arg>                peptide/protein pair file
 -decoy_label <arg>        Label for decoy: rev_ in default
 -decoy_pos <arg>          Position of decoy label: 0 (start, in default); 1 (end)
 -entrapment_label <arg>   Label for entrapment: _p_target in default
 -entrapment_pos <arg>     Position of entrapment label: 0 (start); 1 (end, in default)
 -debug                    Print detailed information for debugging
 -h                        Print this usage information
Generate a peptide level entrapment database using the human target database UP000005640_9606.fasta (~20k human proteins). The database can be downloaded from UniProt.
java -jar fdrbench-1.0.0.jar -I2L -level peptide -db UP000005640_9606.fasta -o UP000005640_9606_entrapment_pep.txt -uniprot -diann -fix_nc cUsing the above command line, a peptide level entrapment database in FASTA format "UP000005640_9606_entrapment_pep.fasta" and a peptide tsv format file "UP000005640_9606_entrapment_pep.txt" will be generated:
The format of the Fasta file "UP000005640_9606_entrapment_pep.fasta" looks like below. The Fasta header of each peptide sequence in the file contains "_target" when the sequence is an original target or "_p_target" when the sequence is an entrapment peptide.
>sp|PSLDQLAAHPWMLGADGGVPESCDLR_target|PSLDQLAAHPWMLGADGGVPESCDLR_target
PSLDQLAAHPWMLGADGGVPESCDLR
>sp|PALLAVGGADSLLEDGHQPCSWDMPR_p_target|PALLAVGGADSLLEDGHQPCSWDMPR_p_target
PALLAVGGADSLLEDGHQPCSWDMPR
>sp|QLQGASWELQSLR_target|QLQGASWELQSLR_target
QLQGASWELQSLR
>sp|QQSWLSLQGLEAR_p_target|QQSWLSLQGLEAR_p_target
QQSWLSLQGLEAR
>sp|YPERDNR_target|YPERDNR_target
YPERDNR
The format of the tsv file "UP000005640_9606_entrapment_pep.txt" looks like below. This file is used in FDP calculation.
sequence                    decoy  proteins                                 peptide_type  peptide_pair_index
PSLDQLAAHPWMLGADGGVPESCDLR  No     sp|Q86V86|PIM3_HUMAN                     target        0
PALLAVGGADSLLEDGHQPCSWDMPR  No     sp|Q86V86_p_target|PIM3_HUMAN_p_target   p_target      0
QLQGASWELQSLR               No     sp|Q96N95|ZN396_HUMAN                    target        1
QQSWLSLQGLEAR               No     sp|Q96N95_p_target|ZN396_HUMAN_p_target  p_target      1
YPERDNR                     No     sp|Q5T200|ZC3HD_HUMAN                    target        2
YDRPENR                     No     sp|Q5T200_p_target|ZC3HD_HUMAN_p_target  p_target      2
SYKALADQMNLLLSK             No     sp|Q9UBJ2|ABCD2_HUMAN                    target        3
YSALSNMDLQKLALK             No     sp|Q9UBJ2_p_target|ABCD2_HUMAN_p_target  p_target      3
Below please find the description of each column in the output tsv file "UP000005640_9606_entrapment_pep.txt":
| Column name | Description |
|---|---|
| sequence | peptide sequence (original target peptide or entrapment peptide) |
| decoy | decoy peptide (Yes) or not (No) |
| proteins | protein ID (multiple IDs are separated by ";") |
| peptide_type | peptide type, original target (target) or entrapment (p_target) |
| peptide_pair_index | peptide pair index: an original target peptide and its paired entrapment have the same index |
The above example command line took about 30 seconds to run on a Mac MacBook computer.
Generate a protein level entrapment database using the human target database UP000005640_9606.fasta (~20k human proteins). The database can be downloaded from UniProt:
java -jar fdrbench-1.0.0.jar -level protein -db UP000005640_9606.fasta -o UP000005640_9606_I2L_entrapment.fasta -I2L -diann -uniprot -fix_nc c -checkUsing the above command line, a protein level entrapment database in FASTA format "UP000005640_9606_I2L_entrapment.fasta" will be generated. For each target human protein, an entrapment protein is generated.
The format of the Fasta file "UP000005640_9606_I2L_entrapment.fasta" looks like below. The first protein as shown below is a target human protein while the second protein is its paired entrapment protein. Both command line parameters -diann and -uniprot are set in the command line, so an entrapment label "_p_target" is added in three positions of the Fasta protein header. This format is compatible with DIA-NN search.
>sp|A0A0G2JMI3|HV692_HUMAN Immunoglobulin heavy variable 1-69-2 OS=Homo sapiens OX=9606 GN=IGHV1-69-2 PE=3 SV=2
MDCTWRLLLLVAAATGTHAEVQLVQSGAEVKKPGATVKLSCKVSGYTFTDYYMHWVQQAPGKGLEWMGLVDPEDGETLYAEKFQGRVTLTADTSTDTAYMELSSLRSEDTAVYYCAT
>sp|A0A0G2JMI3_p_target|HV692_HUMAN_p_target Immunoglobulin heavy variable 1-69-2 OS=Homo sapiens OX=9606 GN=IGHV1-69-2_p_target PE=3 SV=2
CWTMDRTGAVEAVQVQAESAGLALTVLHLLKKTAGPVKCSLKYYMATPVDWTQQFSYVGHGKDAPGEEELDVMEGLGYLWTKQFGREAMLTLADYVLDSTTSTSTRDVTACESAYYT
The above example command line took about 10 seconds to run on a Mac MacBook computer.
Generate a peptide level entrapment database using the human target database UP000005640_9606.fasta (~20k human proteins) by taking peptides from Arabidopsis thaliana (UP000002311_559292.fasta) and Saccharomyces cerevisiae (UP000006548_3702.fasta) as entrapments. The database can be downloaded from UniProt.
java -jar fdrbench-1.0.0.jar java -db UP000005640_9606.fasta -o UP000005640_9606_I2L_foreign_species_entrapment_peptide.txt -I2L -diann -uniprot -ms UP000002311_559292.fasta,UP000006548_3702.fasta -enzyme 2 -miss_c 1 -minLength 7 -maxLength 35 -level peptide -fold 1Generate a protein level entrapment database using the human target database UP000005640_9606.fasta (~20k human proteins) by taking proteins from Arabidopsis thaliana (UP000002311_559292.fasta) and Saccharomyces cerevisiae (UP000006548_3702.fasta) as entrapments. The database can be downloaded from UniProt.
java -jar fdrbench-1.0.0.jar java -db UP000005640_9606.fasta -o UP000005640_9606_I2L_foreign_species_entrapment_protein.fasta -I2L -diann -uniprot -ms UP000002311_559292.fasta,UP000006548_3702.fasta -enzyme 2 -miss_c 1 -minLength 7 -maxLength 35 -level protein -fold 1For precursor level FDP calculation, an example input is shown below:
run                                                peptide                             mod_peptide                                     charge  q_value  PEP  protein                                    score
20230406_OLEP08_MMCC_1ug_MB_24min_AS_10ms_4Th_I_1  AAAPAPEEEMDECEQALAAEPK              AAAPAPEEEMDEC(UniMod:4)EQALAAEPK                3       1e-9     0    AAAPAPEEEMDECEQALAAEPK_target              1
20230406_OLEP08_MMCC_1ug_MB_24min_AS_10ms_4Th_I_1  AAASGQPRPEMQCPAEHEEDMYR             AAASGQPRPEMQC(UniMod:4)PAEHEEDMYR               4       1e-9     0    AAASGQPRPEMQCPAEHEEDMYR_target             2
20230406_OLEP08_MMCC_1ug_MB_24min_AS_10ms_4Th_I_1  AAEVWMDEYKNFYYAAVPSAR               AAEVWMDEYKNFYYAAVPSAR                           3       1e-9     0    AAEVWMDEYKNFYYAAVPSAR_target               3
20230406_OLEP08_MMCC_1ug_MB_24min_AS_10ms_4Th_I_1  AAFTVSLDPGPLEQFPHSMEPQLR            AAFTVSLDPGPLEQFPHSMEPQLR                        3       1e-9     0    AAFTVSLDPGPLEQFPHSMEPQLR_target            4
20230406_OLEP08_MMCC_1ug_MB_24min_AS_10ms_4Th_I_1  AAHVLMPHESTVEHTHVDLNEMESPLATR       AAHVLMPHESTVEHTHVDLNEMESPLATR                   4       1e-9     0    AAHVLMPHESTVEHTHVDLNEMESPLATR_target       5
20230406_OLEP08_MMCC_1ug_MB_24min_AS_10ms_4Th_I_1  AALLSPGDPALWAGLMAACHADDKLALVNNTQPK  AALLSPGDPALWAGLMAAC(UniMod:4)HADDKLALVNNTQPK    4       1e-9     0    AALLSPGDPALWAGLMAACHADDKLALVNNTQPK_target  6
20230406_OLEP08_MMCC_1ug_MB_24min_AS_10ms_4Th_I_1  AALQQKENLPVSSDGNLPQQAASAPSR         AALQQKENLPVSSDGNLPQQAASAPSR                     3       1e-9     0    AALQQKENLPVSSDGNLPQQAASAPSR_target         7
20230406_OLEP08_MMCC_1ug_MB_24min_AS_10ms_4Th_I_1  ADMLCNSQSNDLLQHQGSNCGGTSNK          ADMLC(UniMod:4)NSQSNDLLQHQGSNC(UniMod:4)GGTSNK  3       1e-9     0    ADMLCNSQSNDLLQHQGSNCGGTSNK_target          8
20230406_OLEP08_MMCC_1ug_MB_24min_AS_10ms_4Th_I_1  AFLADPSAFVAAAPVAAATTAAPAAAAAPAK     AFLADPSAFVAAAPVAAATTAAPAAAAAPAK                 3       1e-9     0    AFLADPSAFVAAAPVAAATTAAPAAAAAPAK_target     9
The required columns are described below. Decoy hits shouldn't be included in the input file for FDP calcualtion.
| Column name | Description |
|---|---|
| peptide | peptide sequence |
| mod_peptide | peptide modification (optional for peptide level FDR control evaluation) |
| charge | precursor charge (optional for peptide level FDR control evaluation) |
| q_value | FDR reported by the search engine used to generate the result |
| score | precursor or peptide score used to rank precursor or peptide for FDR calculation |
Below is an example command line to run precursor FDP calculation:
java -jar fdrbench-1.0.0.jar -i peptide-fdp_precursor_input.tsv -fold 1 -pep UP000005640_9606_entrapment_pep.txt -level precursor -o peptide-diann_fdp_precursor.csv -score 'score:0'
The output file "peptide-diann_fdp_precursor.csv" contains estimated FDP values using different methods. The file looks like below:
run                                                peptide                             mod_peptide                                     charge  q_value  PEP  protein                                    score  combined_fdp  n_t  n_p  paired_fdp  n_p_t_s  n_p_s_t  vt  lower_bound_fdp
20230406_OLEP08_MMCC_1ug_MB_24min_AS_10ms_4Th_I_1  AAAPAPEEEMDECEQALAAEPK              AAAPAPEEEMDEC(UniMod:4)EQALAAEPK                3       1.0E-9   0.0  AAAPAPEEEMDECEQALAAEPK_target              1      0.0           393  0    0.0         0        0        0   0.0
20230406_OLEP08_MMCC_1ug_MB_24min_AS_10ms_4Th_I_1  AAASGQPRPEMQCPAEHEEDMYR             AAASGQPRPEMQC(UniMod:4)PAEHEEDMYR               4       1.0E-9   0.0  AAASGQPRPEMQCPAEHEEDMYR_target             2      0.0           393  0    0.0         0        0        0   0.0
20230406_OLEP08_MMCC_1ug_MB_24min_AS_10ms_4Th_I_1  AAEVWMDEYKNFYYAAVPSAR               AAEVWMDEYKNFYYAAVPSAR                           3       1.0E-9   0.0  AAEVWMDEYKNFYYAAVPSAR_target               3      0.0           393  0    0.0         0        0        0   0.0
20230406_OLEP08_MMCC_1ug_MB_24min_AS_10ms_4Th_I_1  AAFTVSLDPGPLEQFPHSMEPQLR            AAFTVSLDPGPLEQFPHSMEPQLR                        3       1.0E-9   0.0  AAFTVSLDPGPLEQFPHSMEPQLR_target            4      0.0           393  0    0.0         0        0        0   0.0
20230406_OLEP08_MMCC_1ug_MB_24min_AS_10ms_4Th_I_1  AAHVLMPHESTVEHTHVDLNEMESPLATR       AAHVLMPHESTVEHTHVDLNEMESPLATR                   4       1.0E-9   0.0  AAHVLMPHESTVEHTHVDLNEMESPLATR_target       5      0.0           393  0    0.0         0        0        0   0.0
20230406_OLEP08_MMCC_1ug_MB_24min_AS_10ms_4Th_I_1  AALLSPGDPALWAGLMAACHADDKLALVNNTQPK  AALLSPGDPALWAGLMAAC(UniMod:4)HADDKLALVNNTQPK    4       1.0E-9   0.0  AALLSPGDPALWAGLMAACHADDKLALVNNTQPK_target  6      0.0           393  0    0.0         0        0        0   0.0
20230406_OLEP08_MMCC_1ug_MB_24min_AS_10ms_4Th_I_1  AALQQKENLPVSSDGNLPQQAASAPSR         AALQQKENLPVSSDGNLPQQAASAPSR                     3       1.0E-9   0.0  AALQQKENLPVSSDGNLPQQAASAPSR_target         7      0.0           393  0    0.0         0        0        0   0.0
20230406_OLEP08_MMCC_1ug_MB_24min_AS_10ms_4Th_I_1  ADMLCNSQSNDLLQHQGSNCGGTSNK          ADMLC(UniMod:4)NSQSNDLLQHQGSNC(UniMod:4)GGTSNK  3       1.0E-9   0.0  ADMLCNSQSNDLLQHQGSNCGGTSNK_target          8      0.0           393  0    0.0         0        0        0   0.0
20230406_OLEP08_MMCC_1ug_MB_24min_AS_10ms_4Th_I_1  AFLADPSAFVAAAPVAAATTAAPAAAAAPAK     AFLADPSAFVAAAPVAAATTAAPAAAAAPAK                 3       1.0E-9   0.0  AFLADPSAFVAAAPVAAATTAAPAAAAAPAK_target     9      0.0           393  0    0.0         0        0        0   0.0
Below please find the description of the main columns in the output tsv file "peptide-diann_fdp_precursor.csv":
| Column name | Description |
|---|---|
| peptide | peptide sequence |
| mod_peptide | peptide modification |
| charge | precursor charge |
| q_value | FDR reported by the search engine used to generate the result |
| score | precursor score used to rank precursor for FDR calculation |
| combined_fdp | the FDP estimated using the combined method |
| paired_fdp | the FDP estimated using the paired method |
| lower_bound_fdp | the lower bound FDP |
The above example command line took about 30 seconds to run on a Mac MacBook computer.
For protein level FDP calculation, an example input is shown below. Only the three columns protein, q_value and score are required. Decoy hits shouldn't be included in the input file for FDP calcualtion.
Protein.Group  PG.Q.Value  q_value     protein  score
P62857         1.64447e-4  1.64447e-4  P62857   1
P29590         1.64447e-4  1.64447e-4  P29590   2
O95989         1.64447e-4  1.64447e-4  O95989   3
P61006         1.64447e-4  1.64447e-4  P61006   4
Q70J99         1.64447e-4  1.64447e-4  Q70J99   5
P36404         1.64447e-4  1.64447e-4  P36404   6
Q71SY5         1.64447e-4  1.64447e-4  Q71SY5   7
Q9BPW8         1.64447e-4  1.64447e-4  Q9BPW8   8
Q8WUP2         1.64447e-4  1.64447e-4  Q8WUP2   9
| Column name | Description |
|---|---|
| protein | protein ID (multiple IDs are separated by ";"). Each row is a protein group |
| q_value | FDR reported by the search engine used to generate the result |
| score | protein score used to rank protein for FDR calculation |
Below is an example command line to run protein FDP calculation. The database used to generate the identification result must be generated using FDRBench. The command line parameter -score is set to use the column "score" as a secondary ranking score in FDP calculation. The number 0 indicates lower score is better (more confident). The example file protein-fdp_protein_input.tsv is available in the example folder.
java -jar fdrbench-1.0.0.jar -i example/protein-fdp_protein_input.tsv -level protein -o protein-diann_fdp_protein.csv -score 'score:0' -fold 1 -pick firstThe output file "protein-diann_fdp_protein.csv" contains estimated FDP values using different methods. The file looks like below:
Protein.Group  PG.Q.Value  q_value     protein  score  combined_fdp  n_t   n_p  paired_fdp  n_p_t_s  n_p_s_t  vt  lower_bound_fdp
P62857         1.64447E-4  1.64447E-4  P62857   1      0.0           6079  0    0.0         0        0        0   0.0
P29590         1.64447E-4  1.64447E-4  P29590   2      0.0           6079  0    0.0         0        0        0   0.0
O95989         1.64447E-4  1.64447E-4  O95989   3      0.0           6079  0    0.0         0        0        0   0.0
P61006         1.64447E-4  1.64447E-4  P61006   4      0.0           6079  0    0.0         0        0        0   0.0
Q70J99         1.64447E-4  1.64447E-4  Q70J99   5      0.0           6079  0    0.0         0        0        0   0.0
Below please find the description of the main columns in the output tsv file "protein-diann_fdp_protein.csv":
| Column name | Description |
|---|---|
| protein | protein ID (multiple IDs are separated by ";"). Each row is a protein group |
| q_value | FDR reported by the search engine used to generate the result |
| score | protein score used to rank protein for FDR calculation |
| combined_fdp | the FDP estimated using the combined method |
| paired_fdp | the FDP estimated using the paired method |
| lower_bound_fdp | the lower bound FDP |
The above example command line took about 5 seconds to run on a Mac MacBook computer.
R function "plot_fdp_fdr" used to generate an FDP vs FDR plot. The result can also be visualized using the GUI introduced above.
library(tidyverse)
library(ggpubr)

plot_fdp_fdr=function(fdp_file="", # the FDP (in csv format) estimation file generated by FDRBench
                      fdr_max=NULL,
                      fig_title=NULL,
                      scale_xy=TRUE,
                      add_numbers=FALSE,
                      numbers_position=NULL,
                      numbers_font_size=11,
                      r=1,
                      fixed_fdr_max=FALSE,
                      max_x=NA,
                      max_y=NA,
                      color_mapping=NULL,
                      legend_position=c(0.7, 0.16),
                      legend_font_size=11,
                      fdr_decimal_place=2,
                      return_data=FALSE,
                      add_max_qvalue=FALSE) {
  if(is.null(color_mapping)){
    color_mapping <- c("Paired method" = "#7CAE00", "Sample method" = "#C77CFF", "Lower bound" = "#00BFC4", "Combined method" = "#F8766D")
  }
  x <- read_csv(fdp_file)
  if("paired_fdp" %in% names(x)){
    if(r>=2){
      dat <- x %>% select(q_value,combined_fdp,paired_fdp,lower_bound_fdp) %>% distinct() %>%
        rename(`Combined method`=combined_fdp,`Matched method`=paired_fdp,`Lower bound`=lower_bound_fdp) %>%
        gather(key = "Method",value = "FDP",-`q_value`) %>% select(q_value,FDP,Method)
      dat$Method <- factor(dat$Method, levels = c("Combined method","Matched method","Lower bound"))
    }else{
      dat <- x %>% select(q_value,combined_fdp,paired_fdp,lower_bound_fdp) %>% distinct() %>%
        rename(`Combined method`=combined_fdp,`Paired method`=paired_fdp,`Lower bound`=lower_bound_fdp) %>%
        gather(key = "Method",value = "FDP",-`q_value`) %>% select(q_value,FDP,Method)
      dat$Method <- factor(dat$Method, levels = c("Combined method","Paired method","Lower bound"))
    }
  }else{
    dat <- x %>% select(q_value,combined_fdp,lower_bound_fdp) %>% distinct() %>%
      rename(`Combined method`=combined_fdp,`Lower bound`=lower_bound_fdp) %>%
      gather(key = "Method",value = "FDP",-`q_value`) %>% select(q_value,FDP,Method)
    dat$Method <- factor(dat$Method, levels = c("Combined method","Lower bound"))
  }


  max_fdp <- max(c(dat$FDP,dat$q_value))
  if(!is.null(fdr_max)){
    if(fixed_fdr_max){
      max_fdp <- fdr_max
    }else{
      max_fdp <- min(c(fdr_max,max_fdp))
    }
  }

  gg1 <- ggplot(dat,aes(x=q_value,y=FDP,color=Method)) +
    geom_abline(slope = 1,intercept = 0,color="gray")+
    geom_line()+
    xlab("FDR threshold")+
    ylab("Estimated FDP")+
    theme_bw()+
    theme_pubr(base_size = 12,border = TRUE)

  if(!is.null(color_mapping)){
    gg1 <- gg1 + scale_color_manual(values = color_mapping)
  }

  if(scale_xy){

    if(!is.na(max_x) || !is.na(max_y)){
      gg1 <- gg1 + geom_vline(xintercept = 0.01,linetype=2,color="blue")
      if(!is.na(max_x)){
        gg1 <- gg1 + xlim(0,max_x) + scale_x_continuous(labels = scales::percent,limits =c(0,max_x))
      }else{
        gg1 <- gg1 + xlim(0,max_fdp)+ scale_x_continuous(labels = scales::percent,limits =c(0,max_fdp))
      }
      if(!is.na(max_y)){
        gg1 <- gg1 + ylim(0,max_y) + scale_y_continuous(labels = scales::percent,limits =c(0,max_y))
      }else{
        gg1 <- gg1 + ylim(0,max_fdp) + scale_y_continuous(labels = scales::percent,limits =c(0,max_fdp))
      }
    }else{
      gg1 <- gg1 + geom_vline(xintercept = 0.01,linetype=2,color="blue")+
        xlim(0,max_fdp)+
        ylim(0,max_fdp)+
        scale_y_continuous(labels = scales::percent,limits =c(0,max_fdp))+
        scale_x_continuous(labels = scales::percent,limits =c(0,max_fdp))
    }
  }

  gg1 <- gg1 + theme(legend.position="inside",
                     legend.position.inside = legend_position,
                     legend.background = element_blank(),
                     legend.text=element_text(size=legend_font_size),
                     legend.title=element_text(size=legend_font_size),
                     plot.margin = unit(2*c(0.1, 0.1, 0.1, 0.1),"inches"),
                     axis.text.y = element_text(angle = 90, hjust = 0.5))


  if(!is.null(fig_title)){
    gg1 <- gg1 + ggtitle(fig_title)
  }

  added_numbers <- NULL
  if(add_numbers){
    if(fdr_decimal_place==1){
      y <- dat %>% filter(q_value<=0.01) %>% group_by(Method) %>% arrange(desc(q_value)) %>% filter(row_number()==1) %>% summarise(FDP001=max(FDP)) %>% mutate(ratio=sprintf("%.1f%%",FDP001*100))
    }else if(fdr_decimal_place==2){
      y <- dat %>% filter(q_value<=0.01) %>% group_by(Method) %>% arrange(desc(q_value)) %>% filter(row_number()==1) %>% summarise(FDP001=max(FDP)) %>% mutate(ratio=sprintf("%.2f%%",FDP001*100))
    }else{
      y <- dat %>% filter(q_value<=0.01) %>% group_by(Method) %>% arrange(desc(q_value)) %>% filter(row_number()==1) %>% summarise(FDP001=max(FDP)) %>% mutate(ratio=sprintf("%.4f%%",FDP001*100))
    }
    if(abs(max_fdp-0.01)<=0.02){
      added_numbers <- paste("Total discoveries:",nrow(x %>% filter(q_value<=0.01)),"\n",paste(y$Method,y$ratio,sep=":",collapse = "\n"),sep="")
      if(add_max_qvalue){
        added_numbers <- paste(added_numbers,"\n","Max q-value:",sprintf("%.2e",max(x$q_value)),sep="")
      }
      if(is.null(numbers_position)){
        gg1 <- gg1 + annotate("text", x = max_fdp*0.1, y = 0.9*max_fdp, label = added_numbers, color = "black", size = numbers_font_size/.pt,hjust = 0)
      }else{
        gg1 <- gg1 + annotate("text", x = numbers_position[1], y = numbers_position[2], label = added_numbers, color = "black", size = numbers_font_size/.pt,hjust = 0)
      }

    }else{
      added_numbers <- paste("Total discoveries:",nrow(x %>% filter(q_value<=0.01)),"\n",paste(y$Method,y$ratio,sep=":",collapse = "\n"),sep="")
      if(add_max_qvalue){
        added_numbers <- paste(added_numbers,"\n","Max q-value:",sprintf("%.2e",max(x$q_value)),sep="")
      }
      if(is.null(numbers_position)){
        gg1 <- gg1 + annotate("text", x = 0.01*1.05, y = 0.9*max_fdp, label = added_numbers, color = "black", size = numbers_font_size/.pt,hjust = 0)
      }else{
        gg1 <- gg1 + annotate("text", x = numbers_position[1], y = numbers_position[2], label = added_numbers, color = "black", size = numbers_font_size/.pt,hjust = 0)
      }
    }
  }


  if(return_data){
    return(list(gg=gg1,data=dat,added_numbers=added_numbers))
  }else{
    return(gg1)
  }

}
The following R code can be used to generate an FDR vesus FDP plot as shown below:
## load the above R function first before running the following R code.
fdp_plot <- plot_fdp_fdr("tide-peptide-percolator_fdp_peptide.csv",fdr_max = NULL,add_numbers = TRUE, fixed_fdr_max=TRUE)
pdf("fdr-fdp.pdf",width = 4.5,height = 4.5)
print(fdp_plot)
dev.off()
The dashed vertical line is at the 1% FDR threshold, as are the numbers reported in text in the figure.
Wen, B., Freestone, J., Riffle, M. et al. Assessment of false discovery rate control in tandem mass spectrometry analysis using entrapment. Nat Methods 22, 1454–1463 (2025).