desmospy has these immediate goals:
- present the Desmos API with consistent terminology
- keep it simple, keep it pythonic
Basic usage is very simple. Create an instance of Calculator, then assign to one of its members.
from desmospy import Calculator

c = Calculator()
c.y = 1/2 * c.x + 3
c.show()
More advanced plots can be created with comparisons and the .set() method:
c.a = 0.3
a,x,y = c.a,c.x,c.y

c.set(y < a*x)
c.set(y >= a*x**2)
c.set(a*x*y == 1)
c.show()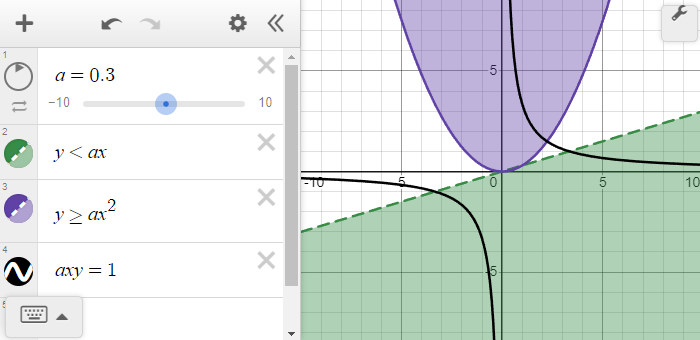
Equations and inequalities can also be combined; first let's define two ellipse regions.
A = (x**2 / 49 + y**2 / 16 <= 1)
B = (x**2 / 16 + y**2 / 49 <= 1)
We can then take the union, also known as a logical OR | of the regions.
c.set(A | B)
c.show()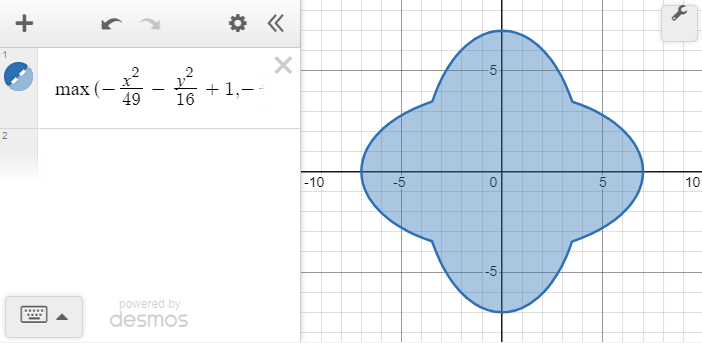
We can also take the intersection of the same regions, with the logical AND & operation.
c.set(A & B)
c.show()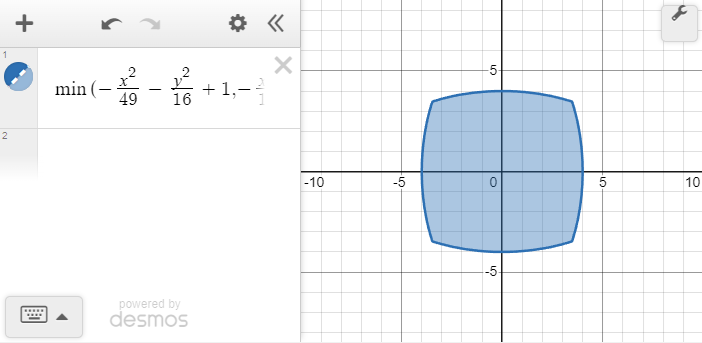
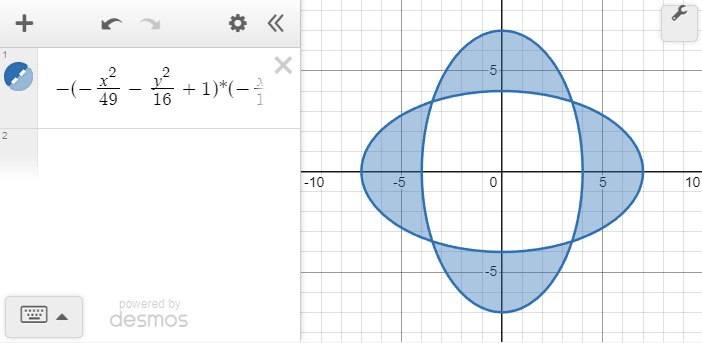
This leaves the logical XOR ^ operation.
c.set(A ^ B)
c.show()